The Mobile Market Index
Analyzing your app download and revenue trends is crucial to growing your mobile app or game, but when you only look at your trends it's hard to tell if changes are related to your actions or larger market trends.
Historically, the scale of market data necessary to view trends hasn't been easy to access or affordable for most developers. That's why we've created the Mobile Market Index, which is available to all Appfigures members on any plan (including the free plan).
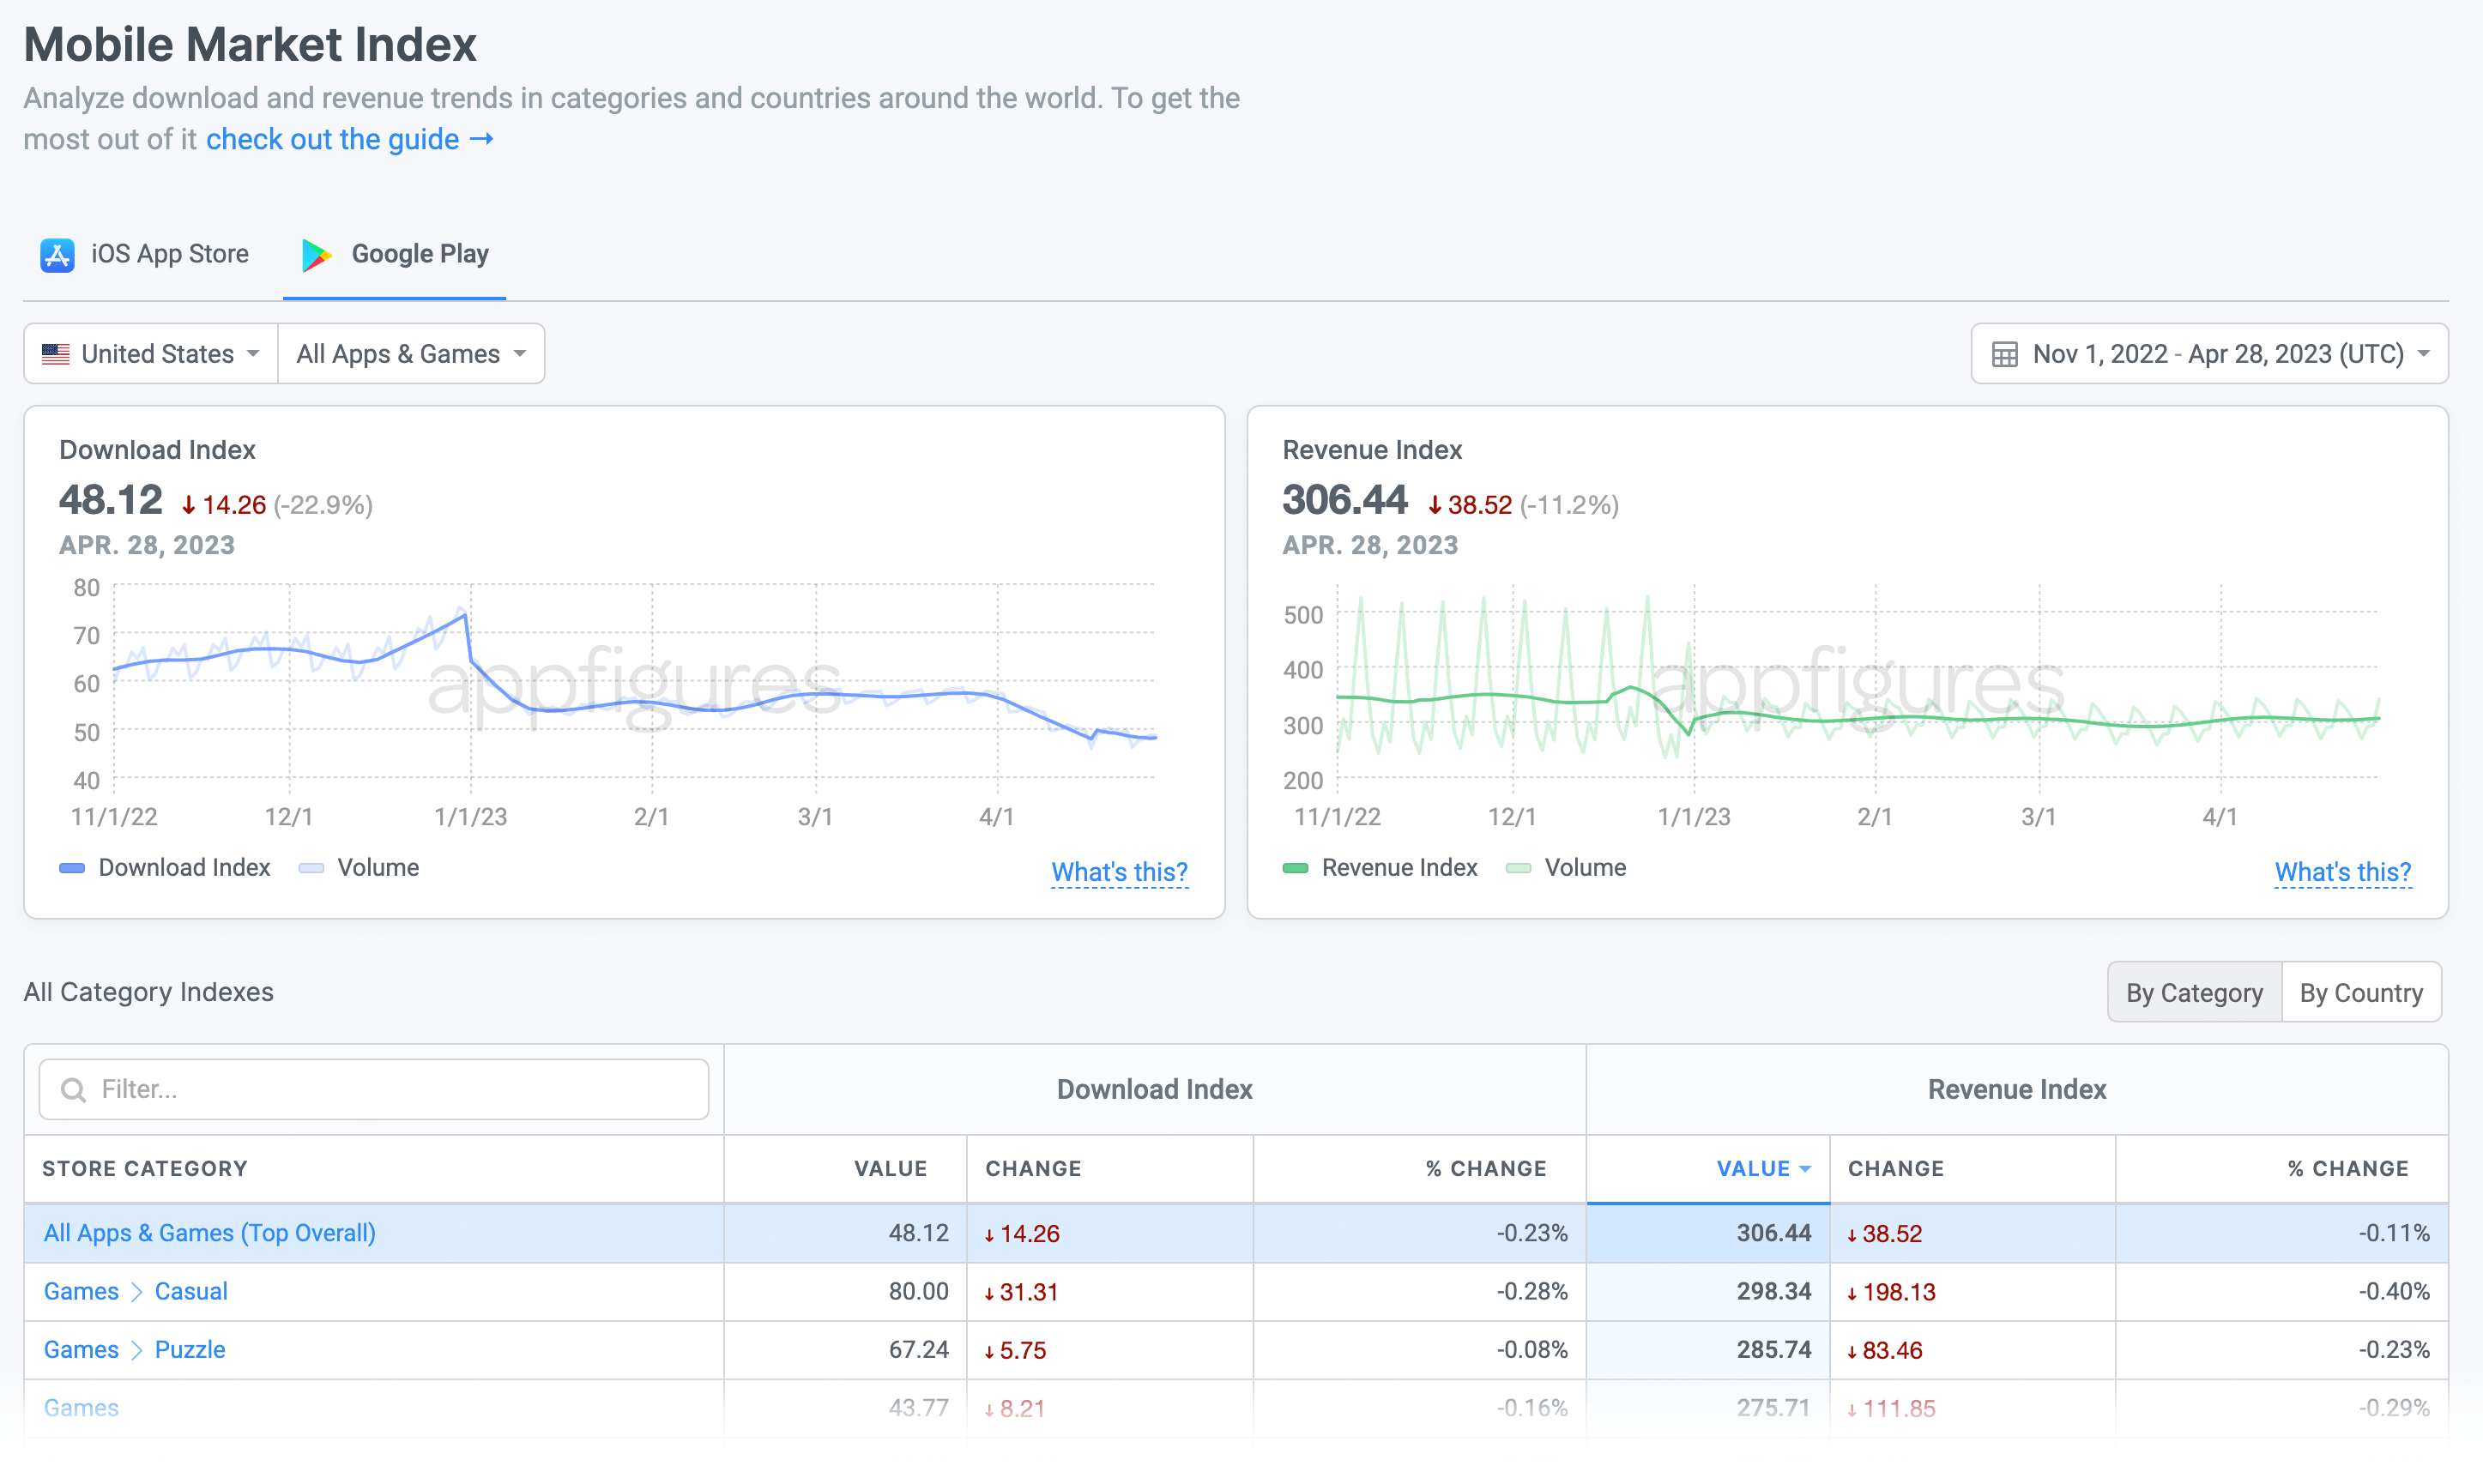
The Mobile Market Index provides a normalized view of download and revenue growth across categories and countries for the iOS App Store and Google Play.
It gives you the context you need to understand your trends and also provides insight into how different categories are growing (or shrinking) to help you make more informed product decisions.
The Formula
To create the daily index value we:
- Combine the estimated downloads (or revenue) of the top 25 apps in each category and country
- Compare the total to the total on January 1st, 2018 (see why below)
- Apply a trending algorithm to adjust for the strong seasonality that exists in both the App Store and Google Play.
The result is a value that indicates growth quickly and without having to worry about actual download or revenue volumes, which are very large numbers that are hard to keep track of.
The value starts at 100 and goes up as downloads and revenue grow, or down when they shrinks.
Different categories and countries show different behavior patterns, where some such as Music have been shrinking over time (Index value 84.62), and others such as Entertainment have been growing (index value of 129.62).
Using the Mobile Market Index to Benchmark Performance
Monitoring the download trends in your category adds important context to your own trends by showing you whether changes you're seeing are specific to your app or larger market movements.
For example, if you've noticed a downward trend in downloads for your app, without the index it'd be impossible to tell if that's a result of a market shift or something specific to your app such as a competitor spending more on ads and taking away new users.
Take for example the Sport & Fitness category for Apple and Google in the US. It shifts quite a bit throughout the year:
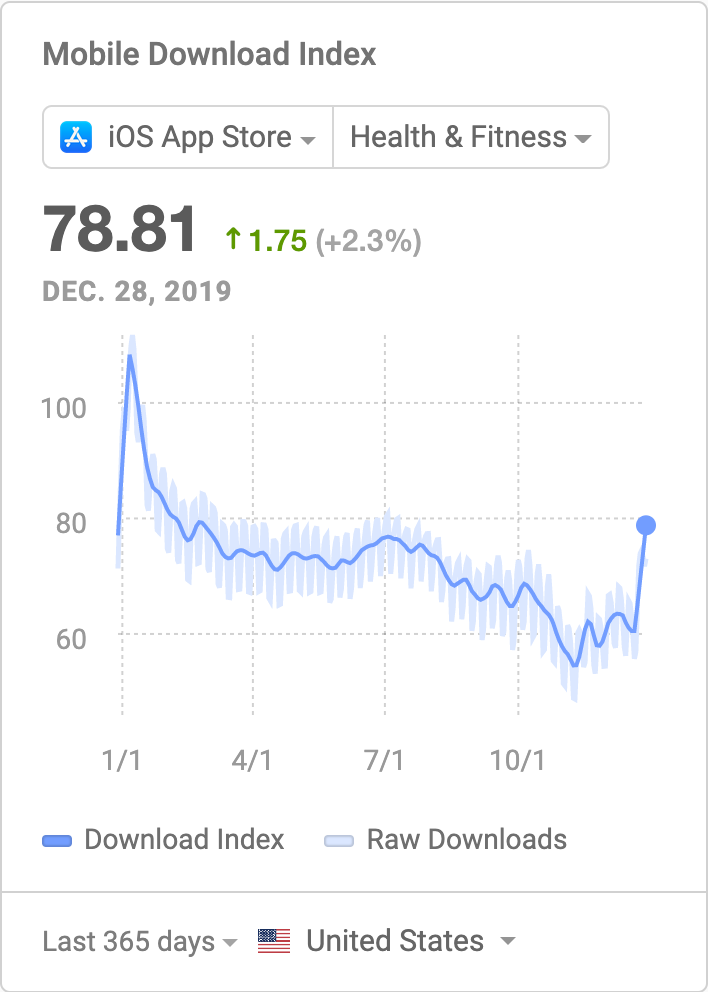
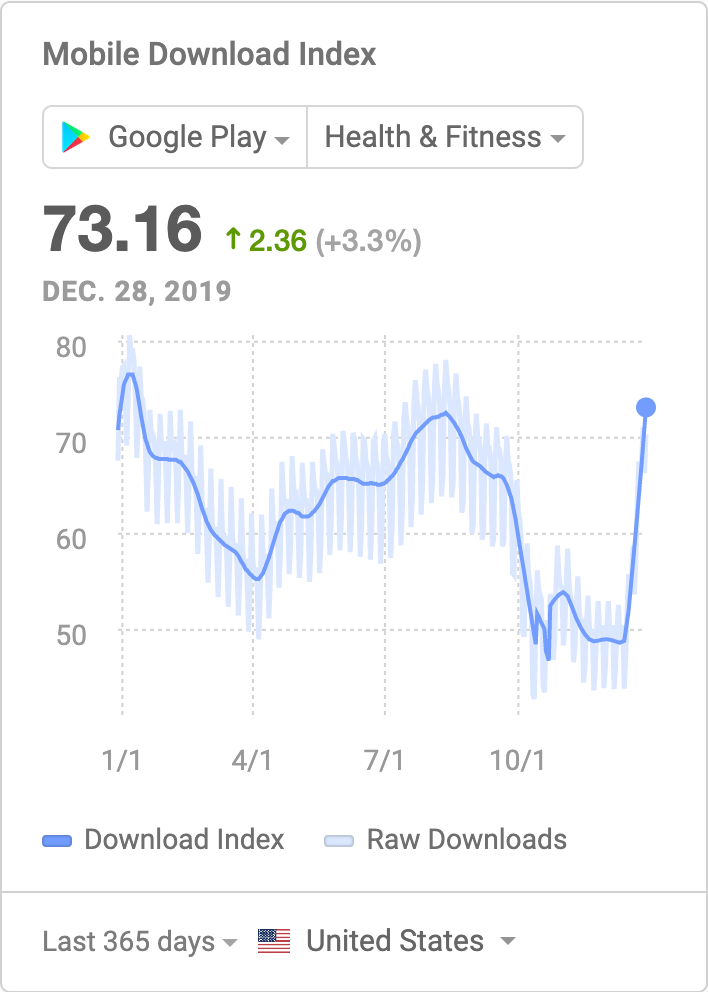
Earlier in the year there are considerably more downloads across the entire category, so you can expect your app to also see more downloads. As new year's resolutions wear off however downloads drop considerably, so you can also expect your downloads to drop.
If your apps have been in the store for more than a year you already know this. But, how do your peaks and drops compare to the rest of the category? Looking at the mobile Downloads Index you can quickly tell if you're outperforming (or underperforming), and if you're spending on user acquisition, when to push harder.
The index provides insights that are essential to the success of every app business, which is why it's available for free to every Appfigures member. Not a member yet? Sign up for free
Adjusting for Seasonality
Different types of apps have different download patterns over the course of the week. Games are downloaded more over the weekend while business apps are downloaded more during the week. This is called seasonality and it makes being able to compare index values for different week days nearly impossible.
To handle that we adjust the daily downloads volume to create a smoother trend line which removes the seasonality and makes it possible to compare days that aren't the same.
Frequently Asked Question
Where can I find the Mobile Market Index in my account?
The Index is available for free on any plan as a widget in the Overview report as well as a full blown report in the Market Intelligence section.
Can I use the Mobile Market Index for free?
Yes! We're on a journey to help every developer make more informed decisioned. All you need to do is be an Appfigures member and track your apps with us.
How often is the index updated?
The index and the underlying data that's used to calculate it are updated daily.
Why are downloads compared to January 1st, 2018?
Stores have evolved a lot over the years, changing their interfaces and ways of promoting apps. January 1st, 2018 is a stable point after which both Apple and Google have not made large enough changes that would change download trends.
Can I use the Mobile market Index if I don't have apps?
Yes. If you're not tracking your apps with us you can still use the Index. Many investors and analysts do. Contact sales to get started.
Can I access the Mobile Market Index programmatically?
We're working on an API for the Mobile Market Index and will be rolling it out soon. Make sure you're subscribed to email updated to ensure you know when that happens.